
BY LOU READE
Gathering useful data – whether from the heart of a nuclear reactor or the bottom of the sea – requires remote sensors and a lot of processing power. Lou Reade reports
Remote sensing is used everywhere from pollution monitoring to industrial control and demand for the technology is thriving. A 2026 report from US-based Market Research Future put the global market for remote sensing at more than $7bn in 2024 – and projects it will grow at more than 5%/year to exceed $12bn by 2035. While this is dominated by satellite monitoring, there is also huge demand for environmental sensors. Here, the market is expected to swell from $2.4bn today to over $6bn in 2035, according to a 2025 report from Global Market Insights. The report notes that Internet of Things (IoT) sensor networks are driving ‘smart’ monitoring; AI-driven predictive analysis enables early detection of pollutants; and portable sensors extend the scope of detection.
While commercial applications are well established, scientists are working to extend the reach and capabilities of these monitoring devices. Researchers in Hong Kong, for example, have been working on devices to identify micro- and nanoplastics. In 2025, they reported developing a biosensor that detects and quantifies microplastics in real-world samples (ACS Sensors, 2025, DOI: 10.1021/acssensors.5c01120).
Microorganisms such as Pseudomonas aeruginosa naturally form a biofilm on plastic surfaces. The researchers created a gene modified version of the bacterium that expresses a specific protein when the bacterium is in contact with plastic. In response, a second gene produces a green fluorescent protein.
‘This helps us detect microplastics that are hard to find using traditional methods,’ says Song Lin Chua, associate professor in the department of applied biology and chemical technology at Hong Kong Polytechnic University.
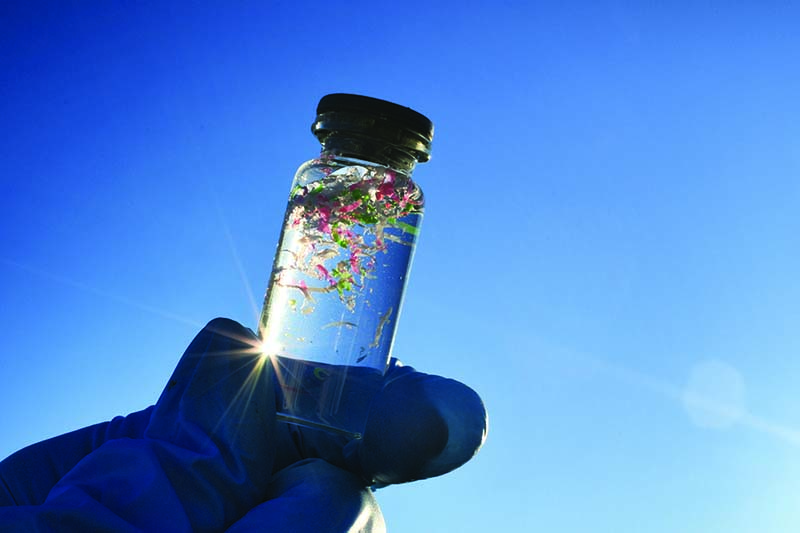
Traditional methods might involve isolating microplastic particles and using an electron microscope to count them – a slow and expensive process. Song’s method can reportedly produce a result in three hours with a detection limit of 1ng/ml. When tested in the lab the sensor fluoresced in vials containing plastic, but not in vials containing other materials such as glass and sand. The researchers have also tested ‘real’ samples – including seawater – and found microplastic levels of 100ppm.
One potential confounding factor are algae, which are of similar size and could lead to a false positive result. This can be removed by filtration or degraded with hydrogen peroxide. Song is looking to commercialise the technique via the university, with a plan to scale up production of the biosensors. If successful, the first customers would be government agencies that track pollution, and wastewater treatment companies, he says.
The technique is restricted to microplastic particles – and no smaller – because the bacterium is of similar size. However, the researchers have developed a second device that uses microfluidics to detect and quantify nanoplastics. This device concentrates the nanoplastics into larger ‘clusters’ which can then be detected and analysed (Cell Reports Sustainability, 2025, DOI: 10.1016/j.crsus.2025.100575).
‘Nanoplastics are too small to be easily separated,’ says Song. ‘You can use an ultra-speed centrifuge, but it takes a few hours.’
The technique, called spiral inertial microfluidics (Simf), has previously been used for cell sorting, but this is the first time it has been applied to nanoplastics, says Song. The first step is to remove ‘larger’ particles – everything from sand to microplastics – using filtration. Chemical treatment removes living species such as viruses.
The ‘cleaned’ sample is then fed through the microfluidic device, which has two main functions. A lower ‘chamber’ encourages nanoparticles to form ‘clusters’ – with the help of alum particles. The second part comprises a nine-loop spiral, which applies a centrifugal force. Heavier particles that have formed clusters are captured and concentrated at the end. The aggregates are large enough to analyse using Raman spectroscopy, which can identify which polymers are present. The optimum time for aggregation was 20 minutes. Samples can also be stained and studied using microscopy.
Song says the device is relatively easy to create in the lab but would be difficult to scale up because of its precise dimensions. Despite these difficulties, he has begun talking to potential collaborators and customers. He is collaborating with a fish farm, which is concerned about levels of nanoplastics in the food chain. This customer is located remotely, making it difficult to send samples to a laboratory.
‘A device like this would help them take measurements onsite, so it is ideal for use out in the field,’ Song says.
Light work
Japanese researchers have also used microfluidics to boost detection of environmental pollutants. In this case, by developing a self-powered sensor to detect amines in water using electrochemiluminescence (ECL).
‘Since this [method] does not require a power supply, it opens new possibilities for applications such as pollutant detection in rivers or pipelines using natural flow energy,’ says Shinsuke Inagi, professor in the school of materials and chemical technology at Tokyo Institute of Science (Nature Commun., 2025, DOI: 10.1038/s41467-025-63548-2).
The researchers chose to detect amines because of their widespread use in industrial processes and due to the known toxicity of some amines. The microfluidic device produces light signals to indicate contamination. It comprises two chambers containing platinum wire electrodes, connected by a channel filled with porous material. Pushing liquid through the channel, with a hand-operated syringe, generates the 2-3V needed to trigger redox reactions at the electrodes.
‘Once the technology has become more robust, a continuous natural water flow, for example, in a river, could provide the necessary electrical energy to run the device,’ says Inagi.
Cable sensors
Meanwhile, in Germany, researchers have begun an ambitious project called SAFAtor (Smart Cables And Fiber-optic Sensing Amphibious Demonstrator) to collect more extensive environmental data using modified undersea telecoms cables as ‘sensors’. The researchers will gather seismic data using a pulsed laser technique, while also taking measurements from the ‘deep ocean’, which is notoriously difficult to access. For the deep ocean side of the project, they will collect continuous data, such as temperature and pressure, that will help improve the reliability of climate models.
‘Right now, these use static or estimated figures,’ says Charlotte Krawczyk, director of geophysics at the GFZ Helmholtz Centre for Geosciences in Potsdam, Germany. ‘If we can feed continuous data from the deep ocean into these models, they will be better.’
SAFAtor aims to design a new type of ‘Smart’ telecoms cable that performs its normal function while also gathering environmental data. Embedded sensors would be housed in the cable’s ‘repeater’ stations – each around 30km apart and used to re-boost the telecoms signal. One key issue is that the cable’s normal telecoms function must be unaffected by the new design. If this can be achieved, the researchers say that using Smart cables to replace end-of-life telecoms cables would allow ‘simple, comparatively inexpensive sensor coverage of the ocean floor’.
‘There’s a huge gap in our observational data [of the deep ocean], which makes it difficult for us to better understand the effects of climate change on the oceans,’ adds Krawczyk. ‘We want to close this gap with SAFAtor.’
The team has considered several locations for laying a demonstrator cable, including one from the Portuguese mainland to the Azores, around 1500km offshore.
A second function of the Smart cable is to gather seismic data using a technique called distributed acoustic sensing (DAS). This works because fibre optic cables have manufacturing inconsistencies, which reflect a signal from a pulsed laser.
‘If we have deformation under the surface, such as from an earthquake, the scatter points change and we get a different signal back,’ Krawczyk says. ‘This is how we measure deformation.’
The principle has now been tested in a proof-of-concept study in Iceland, where a 15km cable was used to detect disturbance from passing traffic. She says the advent of high frequency lasers allows DAS to ‘interrogate’ cables to extract useful information. The robustness of the technique has led some researchers to design specific inconsistencies into fibre optic cables, depending on what they want to detect, although this work is not part of the SAFAtor project.
SAFAtor is now planning permanent coastal monitoring at three sites: Mount Etna, an active volcano in Italy; the North Anatolian fault line that runs near Istanbul in Turkey; and – later in 2026 – at a site in northern Chile plagued by earthquakes.
One recent initiative was to drill a vertical borehole at the Etna site. As well as providing more detailed information about the volcano, it helps pinpoint the location of earthquakes, wherever they happen, more accurately.
While both collection methods are largely proven, Krawczyk says a key part of the project will be dealing with the huge amounts of data generated. When testing the concept in Iceland, she says a 15km cable, sampled every 2m, generated 20TB of data.
‘Now imagine what you’d need for continuous data,’ says Krawczyk. ‘It’s not clear how we can manage this.’
Nuclear option
Sometimes, even where no actual sensor exists, it is still possible to gather detailed information. Scientists at Princeton University, US, for example, are looking to AI methods to help them understand how to monitor and control future nuclear plants.
The researchers have developed a machine learning framework that takes data from many sources and uses an AI algorithm to ‘make sense’ of these multiple inputs. Diag2Diag was trained on data from experiments at the National Fusion Facility in the US.
‘Diag2Diag gives the diagnostics a boost without spending hardware money,’ says Egemen Kolemen, professor in the department of mechanical and aerospace engineering. In a recent paper, the authors reported on fusion experiments with around 80 diagnostic systems, and several hundred data streams, monitoring various aspects of the plasma (Nature Commun., 2025, DOI: 10.1038/s41467-025-63492-1). A potential machine learning (ML) model can learn the ‘intrinsic correlations’ between all the diagnostic data and generate a new dataset from others, they say. Kolemen likens this ‘super resolution’ effect – improving the accuracy of the result – to that of using AI to create a high-resolution version of an old, fuzzy photograph.
A critical diagnostic technique in tokomaks is a process called Thomson Scattering (TS), which uses a high-powered laser beam to measure local electron temperature and density. The laser used only measures at 60Hz, but Kolemen says adding ‘cheap diagnostics’ can ‘fill in the gaps’.
‘It means we can get MHz data from cheap equipment,’ he says.
In the paper, the researchers reported analysing and monitoring part of the reactor called the pedestal, which sits at the edge of the plasma. Monitoring the pedestal is very difficult, but vital to enhance plasma performance. Diag2Diag helped confirm the presence of magnetic structures called ‘islands’, which hold the plasma within the tokomak and could help to stabilise the fusion process.
Kolemen says the research illustrates a wider issue of how AI could allow far more precise diagnostics and data analysis to reveal ‘knowledge that you didn’t know you had’.
The team is looking to expand the scope of Diag2Diag. ‘It could be applied to other fusion diagnostics and is broadly applicable to other fields where diagnostic data is missing or limited,’ he says.
Remote sensing is likely to become more prevalent as improved techniques allow us to gather ever more detailed information. While the fields of application are diverse, researchers seem to agree on one critical point: hang on to your data.
For GFZ’s Krawczyk, processing the huge number of sensor outputs will take time. ‘We need to test it to see what it can tell us – so for now we store everything,’ she says.
At Princeton, Kolemen says AI could help to discover new things in vast datasets. ‘You could find things that nobody has seen before if you look at the data with better eyes.’


